Problem 2 - c
- Plot both temperature contours and centerline profiles (T vs. \(x\) or \(y\) through center) for each different method.
CASE1: Jacobi method
- Temperature contour
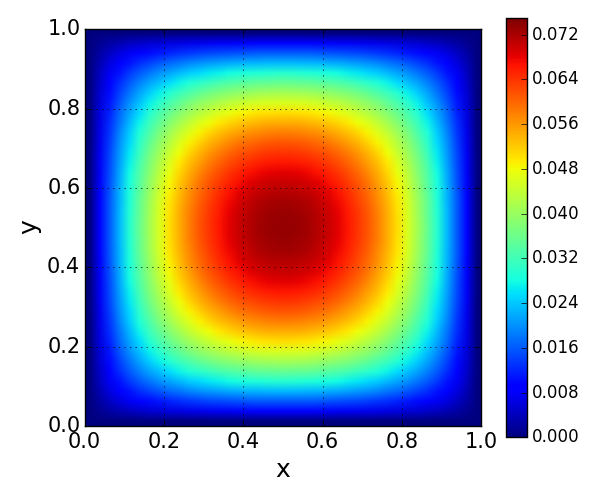
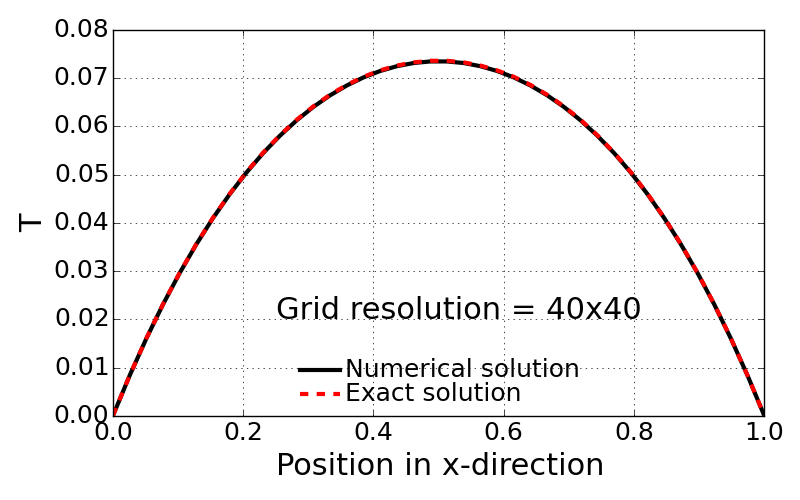
- Temperature along the center line

- Converged at 2068th iteration
- Averaged error: 1.75249104594e-06
- Calculation time: 27.746111 [sec]
CASE2: Gauss-Seidel method
- Temperature contour

- Temperature along the center line

- Converged at 1034th iteration (faster than Jacobi method by a factor of 2)
- Averaged error: 1.74474732047e-06
- Calculation time: 13.999504 [sec]
CASE2: Successive Over-Relaxation (SOR) method (Variant form of G-S method): \(\alpha\) = 1.2
- Temperature contour

- Temperature along the center line
- Converged at 689th iteration (faster than Jacobi method by a factor of 3)
- Averaged error: 1.72946829409e-06
- Calculation time: 9.319121 [sec]